

CodeIgniter 基准测试
codeigniter 基准测试
设定基准点
如果要测量执行一组行所花费的时间或内存使用情况,可以使用 codeigniter 中的 benchmarking 点来计算。 codeigniter 中有一个单独的" 基准测试"类用于此目的。
这个类是自动加载的;你不必加载它。它可以在您的控制器、视图和模型类中的任何地方使用。您所要做的就是标记起点和终点,然后在这两个标记点之间执行 elapsed_time() 函数,您就可以得到执行该代码所需的时间,如下所示。
   $this--->benchmark->mark('code_start');

   // some code happens here
   $this->benchmark->mark('code_end');

   echo $this->benchmark->elapsed_time('code_start', 'code_end');
?>
要显示内存使用情况,请使用函数 memory_usage(),如下面的代码所示。
   echo $this--->benchmark->memory_usage();
?>
示例
创建一个名为 profiler_controller.php 的控制器并将其保存在 application/controller/profiler_controller.php
   class profiler_controller extends ci_controller {

      public function index() {

         //enable profiler
         $this--->output->enable_profiler(true);
         $this->load->view('test');
      }

      public function disable() {

         //disable profiler
         $this->output->enable_profiler(false);
         $this->load->view('test');
      }

   }
?>
创建一个名为 test.php 的视图文件并将其保存在 application/views/test.php
      codeigniter view example


      codeigniter view example
更改 application/config/routes.php 中的 routes.php 文件,为上述控制器添加路由,并在文件末尾添加以下行。
$route['profiler'] = "profiler_controller";
$route['profiler/disable'] = "profiler_controller/disable"
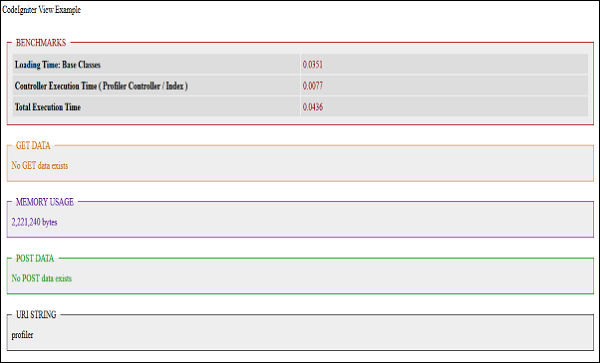
之后,您可以在浏览器的地址栏中输入以下 url 来执行示例。
http://yoursite.com/index.php/profiler
上面的 url 将启用分析器,它会产生一个输出,如下面的屏幕截图所示。
要禁用分析,请执行以下 url。
http://yoursite.com/index.php/profiler/disable
相关文章
- CodeIgniter 教程
- CodeIgniter 使用数据库
- CodeIgniter 库
- CodeIgniter 错误处理
- CodeIgniter 文件上传
- CodeIgniter 表单验证
- CodeIgniter 会话管理
- CodeIgniter Flashdata
- CodeIgniter 临时数据
- CodeIgniter Cookie管理
- CodeIgniter 常用函数
- CodeIgniter 基准测试
- CodeIgniter 添加JS和CSS
- Laravel 验证
- Laravel Facades
- Laravel 契约
- Laravel CSRF保护
- Laravel 认证
- Laravel Artisan控制台
- Laravel 加密
 PHP实战
PHP实战